Kubernetes has emerged as the go-to choice for running applications in containers. It brings advantages compared to traditional deployment methods, like scalability, flexibility and resilience. However, managing and monitoring Kubernetes can be quite difficult. How can you ensure that your applications are running smoothly and reliably? How do you troubleshoot issues before they impact your users?. How can you gain insights into the performance and health of your cluster and its components?
This is where monitoring and alerting play a vital role. Monitoring and alerting are practices for efficiently operating a Kubernetes cluster. They enable you to:
- Collect metrics, logs, and traces from your cluster, nodes, pods, containers, services, and applications.
- Visualize and analyze the data using dashboards, charts, graphs, and tables.
- Alert on anomalies, errors, failures, and SLA breaches using rules, thresholds, and notifications.
- Act on the alerts by investigating the root cause, resolving the issue, or escalating to the appropriate team.
In this article we will discuss the ideas and advantages of monitoring and alerting within Kubernetes. Additionally we will walk through the tools. Recommended approaches for establishing a reliable and scalable monitoring and alerting system, for your Kubernetes cluster.
Challenges in Kubernetes monitoring

Kubernetes monitoring is not a trivial task. It involves collecting and analyzing various types of data from a dynamic and complex system that consists of multiple layers, components, and resources. Some of the common challenges that Kubernetes users face when monitoring their clusters are:
Dynamic and ephemeral environment: Kubernetes pods and containers are continuously being created, updated and removed to align with the intended state and resource availability. This poses a challenge, in monitoring the performance and well being of each pod and container over time as in detecting and resolving any problems that may arise due to configuration adjustments, resource conflicts or failures.
A new meaning for scale: The explosion of microservices has given scale a new meaning. While having 20,000 physical servers may seem manageable, having hundreds of thousands of pods and containers running across multiple nodes and clusters can pose a significant challenge for monitoring and observability. The sheer volume and variety of data generated by Kubernetes and its applications can overwhelm traditional monitoring tools and systems, requiring more scalable and efficient solutions.
Complexity and diversity of data sources: Kubernetes monitoring requires collecting and correlating data from different sources and levels, such as cluster, node, pod, container, service, and application. These data sources include metrics, logs, traces, events, and custom data. Each data source has its own format, semantics, and granularity, which can make it hard to integrate and analyze them in a meaningful way. Moreover, different data sources may require different collection methods, such as agents, sidecars, exporters, or APIs.
Security and compliance: Security is one of the most critical aspects of Kubernetes monitoring, as it can help detect and prevent malicious attacks, data breaches, and unauthorized access. However, security also poses a challenge for monitoring, as it requires ensuring that the data collected and stored is protected and compliant with the relevant regulations and policies. This may involve encrypting, anonymizing, or masking sensitive data, as well as implementing access control and audit mechanisms for the monitoring system and its data.
Vendor lock-in and interoperability: There are many tools and platforms available for Kubernetes monitoring, each with its own features, benefits, and drawbacks. However, choosing a specific tool or platform may also limit the flexibility and portability of the monitoring solution, as it may not be compatible or interoperable with other tools or platforms that are used for other purposes, such as deployment, orchestration, or security. This can result in vendor lock-in and increased costs and complexity. Therefore, it is important to evaluate the trade-offs and requirements of different monitoring solutions and choose the ones that best suit the needs and goals of the Kubernetes users.
The Need for Dedicated Kubernetes Monitoring and Alerting tools
Standard monitoring tools, built to monitor hosts, virtual machines or physical machines might not have the capability to meet the needs and demands of monitoring Kubernetes. There are limitations associated with using monitoring tools for Kubernetes:
-
Lack of scalability: Generic monitoring tools may not be able to handle the large volume and variety of data generated by Kubernetes and its applications. Kubernetes creates, updates, and deletes pods and containers constantly, based on the desired state and the available resources. This results in a high rate of change and a high cardinality of data, which can overwhelm traditional monitoring tools and systems.
-
Lack of visibility: Standard monitoring tools might not offer an all encompassing outlook on the Kubernetes system and its various components. Monitoring Kubernetes involves gathering and correlating data from sources and levels including clusters, nodes, pods, containers, services and applications. These data sources consist of metrics, logs, traces, events and custom data. Each source has its format, meaning and level of detail making it challenging to integrate and analyze them effectively. Additionally different data sources may require collection methods, like agents, sidecars, exporters or APIs.
-
Lack of context: Many conventional monitoring tools may not offer the context and insights for effectively monitoring Kubernetes. Monitoring Kubernetes involves more than assessing system performance and health: it also entails comprehending how the systems behavior and impact affect user experience, business outcomes and costs. Standard monitoring tools may fail to capture and present the key performance indicators (KPIs) service level objectives (SLOs) and service level indicators (SLIs) that hold significance for Kubernetes users in a specific manner.
-
Lack of flexibility: Generic monitoring tools may not be able to adapt and evolve with the Kubernetes system and its users. Kubernetes is a constantly changing and evolving platform, which requires monitoring tools to be able to support new features, integrations, and use cases. Generic monitoring tools may not be able to provide the customization and extensibility that Kubernetes users need to tailor the monitoring solution to their specific needs and goals.
These limitations of generic monitoring tools highlight the need for dedicated Kubernetes monitoring and alerting tools, which are designed and optimized for the Kubernetes environment and its users. Dedicated Kubernetes monitoring and alerting tools can provide the following benefits:
- Scalability: Tools specifically designed for monitoring and alerting in Kubernetes can effectively handle the amount and diverse range of data produced by Kubernetes and its applications. These dedicated tools make use of the capabilities and features of Kubernetes, such, as labels, annotations and custom resources to efficiently gather and organize data while maintaining performance and reliability, in the monitoring system.
- Visibility: Specialized tools for monitoring and alerting in Kubernetes offer a comprehensive understanding of the Kubernetes system and its various components. These tools. Analyze data, from sources and levels allowing users to visualize and interpret the information through user friendly dashboards, charts, graphs and tables.
- Context: Dedicated Kubernetes monitoring and alerting tools can provide the relevant context and insights for Kubernetes monitoring, by capturing and displaying the key performance indicators (KPIs), service level objectives (SLOs), and service level indicators (SLIs) that are specific and meaningful for Kubernetes users. Dedicated Kubernetes monitoring and alerting tools can also provide alerts and notifications, based on rules, thresholds, and anomalies, to inform and empower the Kubernetes users to take the appropriate actions.
- Flexibility: Monitoring and alerting tools specifically designed for Kubernetes have the ability to adjust and grow alongside the Kubernetes system and its users. They can support functionalities, integrations and use cases. Moreover these tools offer a level of customization and flexibility that cater to the requirements and objectives of Kubernetes users.
Prometheus
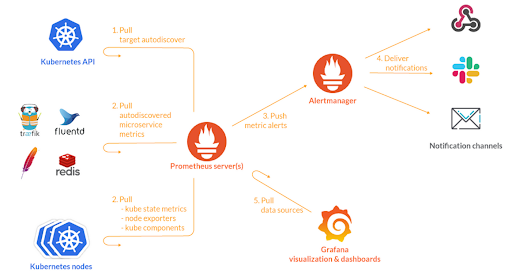
Prometheus is an open-source monitoring and alerting toolkit that is designed for microservices and containers. Prometheus collects and stores metrics from various sources and exposes them to the user in a way that is easy to understand and consume.
Prometheus uses an exporter architecture, where lightweight agents called exporters scrape metrics from Kubernetes objects, such as nodes, pods, and services, and expose them to Prometheus.
How to integrate Prometheus with Kubernetes
Prometheus can be integrated with Kubernetes by using a set of YAML files that contain configurations, permissions, and services that allow Prometheus to access resources and pull information by scraping the elements of your cluster. The following steps show how to install and set up Prometheus monitoring in a Kubernetes cluster:
- Create a monitoring namespace for Prometheus:
apiVersion: v1
kind: Namespace
metadata:
name: monitoring- Create a persistent volume and a persistent volume claim for Prometheus data storage:
apiVersion: v1
kind: PersistentVolume
metadata:
  name: prometheus-pv
  namespace: monitoring
spec:
  capacity:
    storage: 10Gi
  accessModes:
    - ReadWriteOnce
  persistentVolumeReclaimPolicy: Retain
  storageClassName: standard
  hostPath:
    path: /mnt/nfs/promdata
---
apiVersion: v1
kind: PersistentVolumeClaim
metadata:
  name: prometheus-pvc
  namespace: monitoring
spec:
  storageClassName: standard
  accessModes:
    - ReadWriteOnce
  resources:
    requests:
storage: 10Gi- Create a cluster role and a cluster role binding for Prometheus to access cluster-level resources:
apiVersion: rbac.authorization.k8s.io/v1
kind: ClusterRole
metadata:
  name: prometheus
rules:
- apiGroups: [""]
  resources:
  - nodes
  - nodes/proxy
  - services
  - endpoints
  - pods
  verbs: ["get", "list", "watch"]
- apiGroups:
  - extensions
  - networking.k8s.io
  resources:
  - ingresses
  verbs: ["get", "list", "watch"]
- nonResourceURLs: ["/metrics"]
  verbs: ["get"]
---
apiVersion: rbac.authorization.k8s.io/v1
kind: ClusterRoleBinding
metadata:
  name: prometheus
roleRef:
  apiGroup: rbac.authorization.k8s.io
  kind: ClusterRole
  name: prometheus
subjects:
- kind: ServiceAccount
  name: default
namespace: monitoring- Create a config map for Prometheus configuration file:
apiVersion: v1
kind: ConfigMap
metadata:
  name: prometheus-config
  namespace: monitoring
data:
  prometheus.yml: |-
    global:
      scrape_interval: 15s
      evaluation_interval: 15s
    scrape_configs:
    - job_name: 'kubernetes-apiservers'
      kubernetes_sd_configs:
      - role: endpoints
      scheme: https
      tls_config:
        ca_file: /var/run/secrets/kubernetes.io/serviceaccount/ca.crt
      bearer_token_file: /var/run/secrets/kubernetes.io/serviceaccount/token
      relabel_configs:
      - source_labels: [__meta_kubernetes_namespace, __meta_kubernetes_service_name, __meta_kubernetes_endpoint_port_name]
        action: keep
        regex: default;kubernetes;https
    - job_name: 'kubernetes-nodes'
      kubernetes_sd_configs:
      - role: node
      scheme: https
      tls_config:
        ca_file: /var/run/secrets/kubernetes.io/serviceaccount/ca.crt
      bearer_token_file: /var/run/secrets/kubernetes.io/serviceaccount/token
      relabel_configs:
      - action: labelmap
        regex: __meta_kubernetes_node_label_(.+)
      - target_label: __address__
        replacement: kubernetes.default.svc:443
      - source_labels: [__meta_kubernetes_node_name]
        regex: (.+)
        target_label: __metrics_path__
        replacement: /api/v1/nodes/${1}/proxy/metrics
    - job_name: 'kubernetes-pods'
      kubernetes_sd_configs:
      - role: pod
      relabel_configs:
      - source_labels: [__meta_kubernetes_pod_annotation_prometheus_io_scrape]
        action: keep
        regex: true
      - source_labels: [__meta_kubernetes_pod_annotation_prometheus_io_path]
        action: replace
        target_label: __metrics_path__
        regex: (.+)
      - source_labels: [__address__, __meta_kubernetes_pod_annotation_prometheus_io_port]
        action: replace
        regex: ([^:]+)(?::\d+)?;(\d+)
        replacement: ${1}:${2}
        target_label: __address__
      - action: labelmap
        regex: __meta_kubernetes_pod_label_(.+)
      - source_labels: [__meta_kubernetes_namespace]
        action: replace
        target_label: kubernetes_namespace
      - source_labels: [__meta_kubernetes_pod_name]
        action: replace
        target_label: kubernetes_pod_name
    - job_name: 'kubernetes-services'
      kubernetes_sd_configs:
      - role: service
      metrics_path: /probe
      params:
        module: [http_2xx]
      relabel_configs:
      - source_labels: [__meta_kubernetes_service_annotation_prometheus_io_probe]
        action: keep
        regex: true
      - source_labels: [__address__]
        target_label: __param_target
      - target_label: __address__
        replacement: blackbox-exporter.collabnix.com:9115
      - source_labels: [__param_target]
        target_label: instance
      - action: labelmap
        regex: __meta_kubernetes_service_label_(.+)
      - source_labels: [__meta_kubernetes_namespace]
        target_label: kubernetes_namespace
      - source_labels: [__meta_kubernetes_service_name]
target_label: kubernetes_name- Create a deployment for Prometheus server:
apiVersion: apps/v1
kind: Deployment
metadata:
  name: prometheus-deployment
  namespace: monitoring
spec:
  replicas: 1
  selector:
    matchLabels:
      app: prometheus-server
  template:
    metadata:
      labels:
        app: prometheus-server
    spec:
      containers:
        - name: prometheus
          image: prom/prometheus:v2.25.0
          args:
            - "--config.file=/etc/prometheus/prometheus.yml"
            - "--storage.tsdb.path=/prometheus/"
          ports:
            - containerPort: 9090
          volumeMounts:
            - name: prometheus-config-volume
              mountPath: /etc/prometheus/
            - name: prometheus-storage-volume
              mountPath: /prometheus/
      volumes:
        - name: prometheus-config-volume
          configMap:
            defaultMode: 420
            name: prometheus-config
        - name: prometheus-storage-volume
          persistentVolumeClaim:
claimName: prometheus-pvc- Create a service for Prometheus server:
apiVersion: v1
kind: Service
metadata:
  name: prometheus-service
  namespace: monitoring
  annotations:
      prometheus.io/scrape: 'true'
      prometheus.io/port:   '9090'
spec:
  selector:
    app: prometheus-server
  type: NodePort
  ports:
    - port: 8080
      targetPort: 9090
nodePort: 30000- Apply the YAML files to your cluster by using the following command:
kubectl apply -f <filename>.yamlUse cases and benefits
Prometheus can be used for various use cases and benefits, such as:
- Monitoring the performance and health of your Kubernetes cluster, nodes, pods, containers, services, and applications.
- Querying and analyzing the metrics data using PromQL, a flexible query language that allows you to leverage the multi-dimensional data model of Prometheus.
- Visualizing and exploring the metrics data using Grafana, a popular open-source dashboarding tool that integrates with Prometheus.
- Alerting on anomalies, errors, failures, and SLA breaches using Alertmanager, a component of Prometheus that handles alerts and notifications.
- Troubleshooting and debugging issues by using the metrics data as a source of truth and evidence.
- Optimizing and improving the efficiency and reliability of your Kubernetes system by using the metrics data to identify and resolve bottlenecks, resource contention, and configuration problems..
Grafana
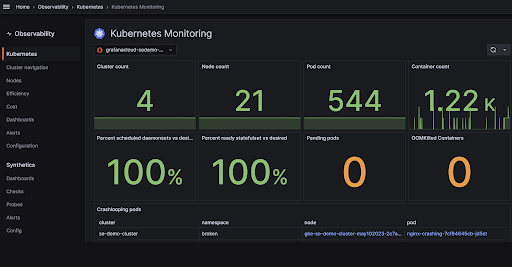
Grafana is a monitoring solution that’s open source. It excels in visualizing time series data. Supports data sources, including Prometheus. With its capabilities it becomes a tool for visualizing Kubernetes metrics. Using Grafana, you can create dashboards and panels that showcase metrics like CPU and memory usage, network throughput and more. Additionally Grafana offers alerting and annotation features along with plugins and integrations, with tools and platforms.
How to integrate Grafana with Kubernetes
Grafana can be integrated with Kubernetes by using a set of YAML files that contain configurations, permissions, and services that allow Grafana to access Prometheus data and expose its web interface. The following steps show how to install and set up Grafana in a Kubernetes cluster:
- Create a monitoring namespace for Grafana, if you have not already done so:
apiVersion: v1
kind: Namespace
metadata:
name: monitoring- Create a persistent volume and a persistent volume claim for Grafana data storage:
apiVersion: v1
kind: PersistentVolume
metadata:
  name: grafana-pv
  namespace: monitoring
spec:
  capacity:
    storage: 5Gi
  accessModes:
    - ReadWriteOnce
  persistentVolumeReclaimPolicy: Retain
  storageClassName: standard
  hostPath:
    path: /mnt/nfs/grafanadata
---
apiVersion: v1
kind: PersistentVolumeClaim
metadata:
  name: grafana-pvc
  namespace: monitoring
spec:
  storageClassName: standard
  accessModes:
    - ReadWriteOnce
  resources:
    requests:
storage: 5Gi- Create a config map for Grafana dashboard providers:
apiVersion: v1
kind: ConfigMap
metadata:
  name: grafana-dashboard-providers
  namespace: monitoring
data:
  provider.yaml: |-
    apiVersion: 1
    providers:
    - name: 'default'
      orgId: 1
      folder: ''
      type: file
      disableDeletion: false
      editable: true
      options:
path: /var/lib/grafana/dashboards- Create a config map for Grafana dashboards:
apiVersion: v1
kind: ConfigMap
metadata:
  name: grafana-dashboards
  namespace: monitoring
data:
  kubernetes-cluster.json: |-
    {
      "annotations": {
        "list": [
          {
            "builtIn": 1,
            "datasource": "-- Grafana --",
            "enable": true,
            "hide": true,
            "iconColor": "rgba(0, 211, 255, 1)",
            "name": "Annotations & Alerts",
            "type": "dashboard"
          }
        ]
      },
      "editable": true,
      "gnetId": 6417,
      "graphTooltip": 0,
      "id": 2,
      "iteration": 1616673468762,
      "links": [],
      "panels": [
        {
          "collapsed": false,
          "datasource": null,
          "gridPos": {
            "h": 1,
            "w": 24,
            "x": 0,
            "y": 0
          },
          "id": 9,
          "panels": [],
          "title": "Cluster",
          "type": "row"
        },
        {
          "cacheTimeout": null,
          "colorBackground": false,
          "colorValue": false,
          "colors": [
            "rgba(245, 54, 54, 0.9)",
            "rgba(237, 129, 40, 0.89)",
            "rgba(50, 172, 45, 0.97)"
          ],
          "datasource": "Prometheus",
          "decimals": null,
          "description": "The number of nodes in the cluster.",
          "format": "none",
          "gauge": {
            "maxValue": 100,
            "minValue": 0,
            "show": false,
            "thresholdLabels": false,
            "thresholdMarkers": true
          },
          "gridPos": {
            "h": 4,
            "w": 3,
            "x": 0,
            "y": 1
          },
          "id": 2,
          "interval": null,
          "links": [],
          "mappingType": 1,
          "mappingTypes": [
            {
              "name": "value to text",
              "value": 1
            },
            {
              "name": "range to text",
              "value": 2
            }
          ],
          "maxDataPoints": 100,
          "nullPointMode": "connected",
          "nullText": null,
          "postfix": "",
          "postfixFontSize": "50%",
          "prefix": "",
          "prefixFontSize": "50%",
          "rangeMaps": [
            {
              "from": "null",
              "text": "N/A",
              "to": "null"
            }
          ],
          "sparkline": {
            "fillColor": "rgba(31, 118, 189, 0.18)",
            "full": false,
            "lineColor": "rgb(31, 120, 193)",
            "show": false
          },
          "tableColumn": "",
          "targets": [
            {
              "expr": "sum(kube_node_info)",
              "format": "time_series",
              "instant": true,
              "intervalFactor": 1,
              "refId": "A"
            }
          ],
          "thresholds": "",
          "title": "Nodes",
          "type": "singlestat",
          "valueFontSize": "80%",
          "valueMaps": [
            {
              "op": "=",
              "text": "N/A",
              "value": "null"
            }
          ],
          "valueName": "current"
        },
        {
          "cacheTimeout": null,
          "colorBackground": false,
          "colorValue": false,
          "colors": [
            "rgba(245, 54, 54, 0.9)",
            "rgba(237, 129, 40, 0.89)",
            "rgba(50, 172, 45, 0.97)"
          ],
          "datasource": "Prometheus",
          "decimals": null,
          "description": "The number of nodes that are in Ready state.",
          "format": "none",
          "gauge": {
            "maxValue": 100,
            "minValue": 0,
            "show": false,
            "thresholdLabels": false,
            "thresholdMarkers": true
          },
          "gridPos": {
            "h": 4,
            "w": 3,
            "x": 3,
            "y": 1
          },
          "id": 3,
          "interval": null,
          "links": [],
          "mappingType": 1,
          "mappingTypes": [
            {
              "name": "value to text",
              "value": 1
            },
            {
              "name": "range to text",
              "value": 2
            }
          ],
          "maxDataPoints": 100,
          "nullPointMode": "connected",
          "nullText": null,
          "postfix": "",
          "postfixFontSize": "50%",
          "prefix": "",
          "prefixFontSize": "50%",
          "rangeMaps": [
            {
              "from": "null",
              "text": "N/A",
              "to": "null"
            }
          ],
          "sparkline": {
            "fillColor": "rgba(31, 118, 189, 0.18)",
            "full": false,
            "lineColor": "rgb(31, 120, 193)",
            "show": false
          },
          "tableColumn": "",
          "targets": [
            {
              "expr": "sum(kube_node_status_condition{condition=\"Ready\", status=\"true\"})",
              "format": "time_series",
              "instant": true,
              "intervalFactor": 1,
              "refId": "A"
            }
          ],
          "thresholds": "",
          "title": "Ready Nodes",
          "type": "singlestat",
          "valueFontSize": "80%",
          "valueMaps": [
            {
              "op": "=",
              "text": "N/A",
              "value": "null"
            }
          ],
          "valueName": "current"
        },
        {
          "cacheTimeout": null,
          "colorBackground": false,
          "colorValue": false,
          "colors": [
            "rgba(245, 54, 54, 0.9)",
"rgba.- Create a deployment for Grafana server:
apiVersion: apps/v1
kind: Deployment
metadata:
  name: grafana-deployment
  namespace: monitoring
spec:
  replicas: 1
  selector:
    matchLabels:
      app: grafana-server
  template:
    metadata:
      labels:
        app: grafana-server
    spec:
      containers:
        - name: grafana
          image: grafana/grafana:7.4.3
          ports:
            - containerPort: 3000
          volumeMounts:
            - name: grafana-config-volume
              mountPath: /etc/grafana
            - name: grafana-dashboard-providers-volume
              mountPath: /etc/grafana/provisioning/dashboards
            - name: grafana-dashboards-volume
              mountPath: /var/lib/grafana/dashboards
            - name: grafana-storage-volume
              mountPath: /var/lib/grafana
      volumes:
        - name: grafana-config-volume
          configMap:
            name: grafana-config
        - name: grafana-dashboard-providers-volume
          configMap:
            name: grafana-dashboard-providers
        - name: grafana-dashboards-volume
          configMap:
            name: grafana-dashboards
        - name: grafana-storage-volume
          persistentVolumeClaim:
claimName: grafana-pvc- Create a service for Grafana server:
apiVersion: v1
kind: Service
metadata:
  name: grafana-service
  namespace: monitoring
spec:
  selector:
    app: grafana-server
  type: NodePort
  ports:
    - port: 8080
      targetPort: 3000
nodePort: 30001- Apply the YAML files to your cluster by using the following command:
kubectl apply -f <filename>.yamlUse cases and benefits
Grafana can be used for various use cases and benefits, such as:
- Visualizing the metrics collected by Prometheus from your Kubernetes cluster, nodes, pods, containers, services, and applications.
- Creating and customizing dashboards and panels that display various metrics, such as CPU and memory usage, network throughput, and more.
- Alerting on anomalies, errors, failures, and SLA breaches using Grafana alerting features or integrating with Alertmanager.
- Annotating and commenting on the dashboards and panels to share insights and collaborate with other users.
- Using plugins and integrations, to extend the functionality and compatibility of Grafana with other tools and platforms.
Thanos
Thanos is a CNCF Sandbox project that builds upon Prometheus components to create a global-scale, highly available monitoring system. It seamlessly extends Prometheus in a few simple steps, enabling long-term storage, cross-cluster federation, downsampling, and more. Thanos leverages the Prometheus 2.0 storage format to store historical metric data in any object storage of your choice, such as GCP, S3, Azure, Swift, and Tencent COS.

How to integrate Thanos with Kubernetes
Thanos can be integrated with Kubernetes by using a set of YAML files that contain configurations, permissions, and services that allow Thanos to access Prometheus data and expose its web interface. The following steps show how to install and set up Thanos in a Kubernetes cluster:
-
Install Prometheus in your cluster, if you have not already done so, by following the steps in the previous section.
-
Create a secret for Thanos to access your object storage:
apiVersion: v1
kind: Secret
metadata:
  name: thanos-objstore-config
  namespace: monitoring
type: Opaque
stringData:
  thanos.yaml: |
    type: S3
    config:
      bucket: "my-bucket"
      endpoint: "s3.amazonaws.com"
      access_key: "my-access-key"
      secret_key: "my-secret-key"
      insecure: false
      signature_version2: false
      encrypt_sse: false
      put_user_metadata: {}
      http_config:
        idle_conn_timeout: 90s
        response_header_timeout: 2m
      trace:
enable: false- Create a service account, a cluster role, and a cluster role binding for Thanos to access cluster-level resources:
apiVersion: v1
kind: ServiceAccount
metadata:
  name: thanos
  namespace: monitoring
---
apiVersion: rbac.authorization.k8s.io/v1
kind: ClusterRole
metadata:
  name: thanos
rules:
- apiGroups: [""]
  resources:
  - nodes
  - nodes/proxy
  - services
  - endpoints
  - pods
  verbs: ["get", "list", "watch"]
- apiGroups:
  - extensions
  - networking.k8s.io
  resources:
  - ingresses
  verbs: ["get", "list", "watch"]
- nonResourceURLs: ["/metrics"]
  verbs: ["get"]
---
apiVersion: rbac.authorization.k8s.io/v1
kind: ClusterRoleBinding
metadata:
  name: thanos
roleRef:
  apiGroup: rbac.authorization.k8s.io
  kind: ClusterRole
  name: thanos
subjects:
- kind: ServiceAccount
  name: thanos
namespace: monitoring- Create a deployment for Thanos sidecar, which runs as a sidecar container along with Prometheus and uploads the Prometheus data blocks to the object storage:
apiVersion: apps/v1
kind: Deployment
metadata:
  name: thanos-sidecar-deployment
  namespace: monitoring
spec:
  replicas: 1
  selector:
    matchLabels:
      app: thanos-sidecar
  template:
    metadata:
      labels:
        app: thanos-sidecar
    spec:
      serviceAccountName: thanos
      containers:
      - name: prometheus
        image: prom/prometheus:v2.25.0
        args:
          - "--config.file=/etc/prometheus/prometheus.yml"
          - "--storage.tsdb.path=/prometheus/"
          - "--web.enable-lifecycle"
          - "--storage.tsdb.retention.time=24h"
          - "--web.route-prefix=/"
        ports:
          - containerPort: 9090
        volumeMounts:
          - name: prometheus-config-volume
            mountPath: /etc/prometheus/
          - name: prometheus-storage-volume
            mountPath: /prometheus/
      - name: thanos-sidecar
        image: quay.io/thanos/thanos:v0.22.0
        args:
          - "sidecar"
          - "--prometheus.url=http://127.0.0.1:9090"
          - "--tsdb.path=/prometheus"
          - "--objstore.config=$(OBJSTORE_CONFIG)"
          - "--grpc-address=0.0.0.0:10901"
          - "--http-address=0.0.0.0:10902"
        ports:
          - containerPort: 10901
          - containerPort: 10902
        env:
          - name: OBJSTORE_CONFIG
            valueFrom:
              secretKeyRef:
                name: thanos-objstore-config
                key: thanos.yaml
        volumeMounts:
          - name: prometheus-storage-volume
            mountPath: /prometheus
      volumes:
        - name: prometheus-config-volume
          configMap:
            name: prometheus-config
        - name: prometheus-storage-volume
          persistentVolumeClaim:
claimName: prometheus-pvc- Create a service for Thanos sidecar:
apiVersion: v1
kind: Service
metadata:
  name: thanos-sidecar-service
  namespace: monitoring
spec:
  selector:
    app: thanos-sidecar
  ports:
    - name: grpc
      port: 10901
      targetPort: 10901
    - name: http
      port: 10902
targetPort: 10902- Create a deployment for Thanos store, which serves as a store gateway and makes the data stored in the object storage accessible to Thanos querier:
apiVersion: apps/v1
kind: Deployment
metadata:
  name: thanos-store-deployment
  namespace: monitoring
spec:
  replicas: 1
  selector:
    matchLabels:
      app: thanos-store
  template:
    metadata:
      labels:
        app: thanos-store
    spec:
      serviceAccountName: thanos
      containers:
      - name: thanos-store
        image: quay.io/thanos/thanos:v0.22.0
        args:
          - "store"
          - "--data-dir=/thanos-store-data"
          - "--objstore.config=$(OBJSTORE_CONFIG)"
          - "--grpc-address=0.0.0.0:10901"
          - "--http-address=0.0.0.0:10902"
          - "--index-cache-size=250MB"
          - "--chunk-pool-size=2GB"
        ports:
          - containerPort: 10901
          - containerPort: 10902
        env:
          - name: OBJSTORE_CONFIG
            valueFrom:
              secretKeyRef:
                name: thanos-objstore-config
                key: thanos.yaml
        volumeMounts:
          - name: thanos-store-data-volume
            mountPath: /thanos-store-data
      volumes:
        - name: thanos-store-data-volume
emptyDir: {}- Create a service for Thanos store:
apiVersion: v1
kind: Service
metadata:
  name: thanos-store-service
  namespace: monitoring
spec:
  selector:
    app: thanos-store
  ports:
    - name: grpc
      port: 10901
      targetPort: 10901
    - name: http
      port: 10902
targetPort: 10902- Create a deployment for Thanos querier, which serves as a query gateway and provides a unified query layer across all the Prometheus servers and Thanos store gateways:
apiVersion: apps/v1
kind: Deployment
metadata:
  name: thanos-querier-deployment
  namespace: monitoring
spec:
  replicas: 1
  selector:
    matchLabels:
      app: thanos-querier
  template:
    metadata:
      labels:
        app: thanos-querier
    spec:
      serviceAccountName: thanos
      containers:
      - name: thanos-querier
        image: quay.io/thanos/thanos:v0.22.0
        args:
          - "query"
          - "--http-address=0.0.0.0:9090"
          - "--query.replica-label=replica"
          - "--store=dnssrv+_grpc._tcp.thanos-sidecar-service.monitoring.svc.cluster.local"
          - "--store=dnssrv+_grpc._tcp.thanos-store-service.monitoring.svc.cluster.local"
        ports:
- containerPort: 9090- Create a service for Thanos querier:
apiVersion: v1
kind: Service
metadata:
  name: thanos-querier-service
  namespace: monitoring
spec:
  selector:
    app: thanos-querier
  type: NodePort
  ports:
    - port: 8080
      targetPort: 9090
nodePort: 30002- Apply the YAML files to your cluster by using the following command:
kubectl apply -f <filename>.yamlUse cases and benefits
Thanos can be used for various use cases and benefits, such as:
- Long-term storage of metrics data in the object storage of your choice, enabling unlimited retention and cost-efficiency.
- Cross-cluster federation of metrics data, enabling global query view
Kubeshark
Kubeshark is a tool that analyzes the traffic in Kubernetes giving users real time insights into the internal network. It. Monitors all the data and information passing through containers, pods, nodes and clusters. Kubeshark takes inspiration from Wireshark, a known network analysis tool. It is specifically designed for use with Kubernetes.

How to integrate Kubeshark with Kubernetes
To integrate Kubeshark with Kubernetes you can utilize a collection of YAML files that encompass configurations, permissions and services. These files enable Kubeshark to access Kubernetes resources and expose its web interface. Below are the steps to install and configure Kubeshark within a Kubernetes cluster:
- Download Kubeshark’s binary distribution from the latest release and make it executable:
curl -L https://github.com/kubeshark/kubeshark/releases/download/v51.0.0/kubeshark-linux-amd64 -o kubeshark
chmod +x kubeshark- Create a monitoring namespace for Kubeshark:
apiVersion: v1
kind: Namespace
metadata:
name: monitoring- Create a cluster role and a cluster role binding for Kubeshark to access cluster-level resources:
apiVersion: rbac.authorization.k8s.io/v1
kind: ClusterRole
metadata:
  name: kubeshark
rules:
- apiGroups: [""]
  resources:
  - nodes
  - nodes/proxy
  - services
  - endpoints
  - pods
  verbs: ["get", "list", "watch"]
- apiGroups:
  - extensions
  - networking.k8s.io
  resources:
  - ingresses
  verbs: ["get", "list", "watch"]
- nonResourceURLs: ["/metrics"]
  verbs: ["get"]
---
apiVersion: rbac.authorization.k8s.io/v1
kind: ClusterRoleBinding
metadata:
  name: kubeshark
roleRef:
  apiGroup: rbac.authorization.k8s.io
  kind: ClusterRole
  name: kubeshark
subjects:
- kind: ServiceAccount
  name: default
namespace: monitoring- Create a deployment for Kubeshark server, which runs as a container and captures the traffic from the Kubernetes cluster:
apiVersion: apps/v1
kind: Deployment
metadata:
  name: kubeshark-deployment
  namespace: monitoring
spec:
  replicas: 1
  selector:
    matchLabels:
      app: kubeshark-server
  template:
    metadata:
      labels:
        app: kubeshark-server
    spec:
      containers:
        - name: kubeshark
          image: kubeshark/kubeshark:v51.0.0
          args:
            - "--config.file=/etc/kubeshark/kubeshark.yml"
            - "--storage.path=/kubeshark/"
          ports:
            - containerPort: 8080
          volumeMounts:
            - name: kubeshark-config-volume
              mountPath: /etc/kubeshark/
            - name: kubeshark-storage-volume
              mountPath: /kubeshark/
      volumes:
        - name: kubeshark-config-volume
          configMap:
            name: kubeshark-config
        - name: kubeshark-storage-volume
emptyDir: {}- Create a config map for Kubeshark configuration file:
apiVersion: v1
kind: ConfigMap
metadata:
  name: kubeshark-config
  namespace: monitoring
data:
  kubeshark.yml: |-
    global:
      capture_interval: 15s
      capture_limit: 1000
    capture_configs:
    - job_name: 'kubernetes-apiservers'
      kubernetes_sd_configs:
      - role: endpoints
      scheme: https
      tls_config:
        ca_file: /var/run/secrets/kubernetes.io/serviceaccount/ca.crt
      bearer_token_file: /var/run/secrets/kubernetes.io/serviceaccount/token
      relabel_configs:
      - source_labels: [__meta_kubernetes_namespace, __meta_kubernetes_service_name, __meta_kubernetes_endpoint_port_name]
        action: keep
        regex: default;kubernetes;https
    - job_name: 'kubernetes-nodes'
      kubernetes_sd_configs:
      - role: node
      scheme: https
      tls_config:
        ca_file: /var/run/secrets/kubernetes.io/serviceaccount/ca.crt
      bearer_token_file: /var/run/secrets/kubernetes.io/serviceaccount/token
      relabel_configs:
      - action: labelmap
        regex: __meta_kubernetes_node_label_(.+)
      - target_label: __address__
        replacement: kubernetes.default.svc:443
      - source_labels: [__meta_kubernetes_node_name]
        regex: (.+)
        target_label: __metrics_path__
        replacement: /api/v1/nodes/${1}/proxy/metrics
    - job_name: 'kubernetes-pods'
      kubernetes_sd_configs:
      - role: pod
      relabel_configs:
      - source_labels: [__meta_kubernetes_pod_annotation_kubeshark_io_capture]
        action: keep
        regex: true
      - source_labels: [__meta_kubernetes_pod_annotation_kubeshark_io_path]
        action: replace
        target_label: __metrics_path__
        regex: (.+)
      - source_labels: [__address__, __meta_kubernetes_pod_annotation_kubeshark_io_port]
        action: replace
        regex: ([^:]+)(?::\d+)?;(\d+)
        replacement: ${1}:${2}
        target_label: __address__
      - action: labelmap
        regex: __meta_kubernetes_pod_label_(.+)
      - source_labels: [__meta_kubernetes_namespace]
        action: replace
        target_label: kubernetes_namespace
      - source_labels: [__meta_kubernetes_pod_name]
        action: replace
        target_label: kubernetes_pod_name
    - job_name: 'kubernetes-services'
      kubernetes_sd_configs:
      - role: service
      metrics_path: /probe
      params:
        module: [http_2xx]
      relabel_configs:
      - source_labels: [__meta_kubernetes_service_annotation_kubeshark_io_probe]
        action: keep
        regex: true
      - source_labels: [__address__]
        target_label: __param_target
      - target_label: __address__
        replacement: blackbox-exporter.collabnix.com:9115
      - source_labels: [__param_target]
        target_label: instance
      - action: labelmap
        regex: __meta_kubernetes_service_label_(.+)
      - source_labels: [__meta_kubernetes_namespace]
        target_label: kubernetes_namespace
      - source_labels: [__meta_kubernetes_service_name]
target_label: kubernetes_name- Create a service for Kubeshark server:
apiVersion: v1
kind: Service
metadata:
  name: kubeshark-service
  namespace: monitoring
spec:
  selector:
    app: kubeshark-server
  type: NodePort
  ports:
    - port: 8080
      targetPort: 8080
nodePort: 30003- Apply the YAML files to your cluster by using the following command:
kubectl apply -f <filename>.yamlUse cases and benefits
Kubeshark can be used for various use cases and benefits, such as:
- Troubleshooting and debugging issues by capturing and analyzing the traffic and payloads between Kubernetes objects, such as pods, services, and nodes.
- Investigating and monitoring the performance and health of your Kubernetes cluster, nodes, pods, containers, services, and applications.
- Detecting and preventing security threats and incidents by inspecting the traffic and payloads for malicious or anomalous patterns.
- Triggering functions or actions based on the traffic and payloads, such as sending alerts, notifications, or commands.
- Exploring and learning about the Kubernetes network and protocols by using the web interface that streams the traffic in real-time.
Kubetail
Kubetail is a bash script that enables you to aggregate (tail/follow) logs from multiple pods in a Kubernetes cluster. This is the same as running "kubectl logs -f " but for multiple pods. Kubetail is useful for monitoring and debugging applications that are distributed across multiple pods, such as microservices.
How to integrate Kubetail with Kubernetes
Kubetail can be integrated with Kubernetes by downloading the kubetail file (or any of the releases) and making it executable. You can also install Kubetail using brew, asdf, or as a ZSH plugin. The following steps show how to install and set up Kubetail in a Kubernetes cluster:
- Download the kubetail file from the latest release and make it executable:
curl -L https://github.com/johanhaleby/kubetail/releases/download/1.6.13/kubetail -o kubetail
chmod +x kubetail- Optionally, move the kubetail file to a directory in your PATH, such as /usr/local/bin:
mv kubetail /usr/local/bin- Test to ensure the version you installed is up-to-date:
kubetail --version- To use Kubetail, simply pass the name of a pod or a part of a pod name as an argument. For example, to tail the logs of all pods that have "my-app" in their name:
kubetail my-app- You can also pass multiple pod names or parts of pod names as arguments. For example, to tail the logs of all pods that have either "frontend" or "backend" in their name:
kubetail frontend backend- You can also use regular expressions to match pod names. For example, to tail the logs of all pods that start with "web" and end with a number:
kubetail -r "^web.*\d$"- You can also use flags to customize the output of Kubetail. For example, you can use the -c flag to specify a container name, the -n flag to specify a namespace, the -l flag to specify a label selector, the -t flag to specify a time format, and the -s flag to specify a since time. For more details, see the Kubetail documentation.
Use cases and benefits
Kubetail can be used for various use cases and benefits, such as:
- Monitoring the logs of multiple pods in real-time, without having to switch between different terminal windows or tabs.
- Debugging issues and errors by seeing the logs of related pods in one stream, with color-coded pod names for easy identification.
- Filtering and searching the logs by using grep or other tools, as Kubetail outputs plain text to standard output.
- Customizing the output by using flags, such as container name, namespace, label selector, time format, and since time..
Conclusion
In this article we’ve provided an introduction to the ideas and advantages of monitoring and alerting in Kubernetes. Additionally we’ve delved into the tools.m, recommended methods for establishing a scalable monitoring and alerting system for your Kubernetes cluster. We’ve covered the following tools:
- Prometheus, an open-source monitoring and alerting toolkit that collects and stores metrics from various sources and exposes them to the user in a way that is easy to understand and consume.
- Grafana, an open-source, full-stack monitoring solution for visualizing time series data, supporting multiple data sources, including Prometheus, and providing dashboards, panels, alerting, and annotation features.
- Thanos, an open-source, CNCF Sandbox project that builds upon Prometheus components to create a global-scale, highly available monitoring system, enabling long-term storage, cross-cluster federation, downsampling, and more.
- Kubeshark, an open-source, API traffic analyzer for Kubernetes, providing real-time, protocol-level visibility into Kubernetes’ internal network, capturing and monitoring all traffic and payloads going in, out and across containers, pods, nodes and clusters.
- Kubetail, a bash script that enables you to aggregate (tail/follow) logs from multiple pods in a Kubernetes cluster, useful for monitoring and debugging applications that are distributed across multiple pods, such as microservices.
Choosing the right combination of tools for your Kubernetes monitoring and alerting system depends on your specific use cases and requirements. Some of the factors that you may want to consider are:
- The scale and complexity of your Kubernetes cluster and applications, and the volume and variety of data that they generate.
- The level of visibility and granularity that you need for your metrics, logs, traces, events, and custom data.
- The type and frequency of alerts and notifications that you want to receive, and the actions that you want to take based on them.
- The storage and retention policy that you want to apply for your historical metric data, and the object storage of your choice.
- The user interface and user experience that you prefer for your dashboards, panels, charts, graphs, tables, and maps.
- The security and compliance standards that you need to follow for your data collection and storage.
- The flexibility and extensibility that you need for your monitoring solution, and the compatibility and interoperability with other tools and platforms that you use.
We hope that this article has provided you with some useful information and guidance for your Kubernetes monitoring and alerting system. If you have any questions or feedback, please feel free to contact us. Thank you for reading!
Leave a Reply