
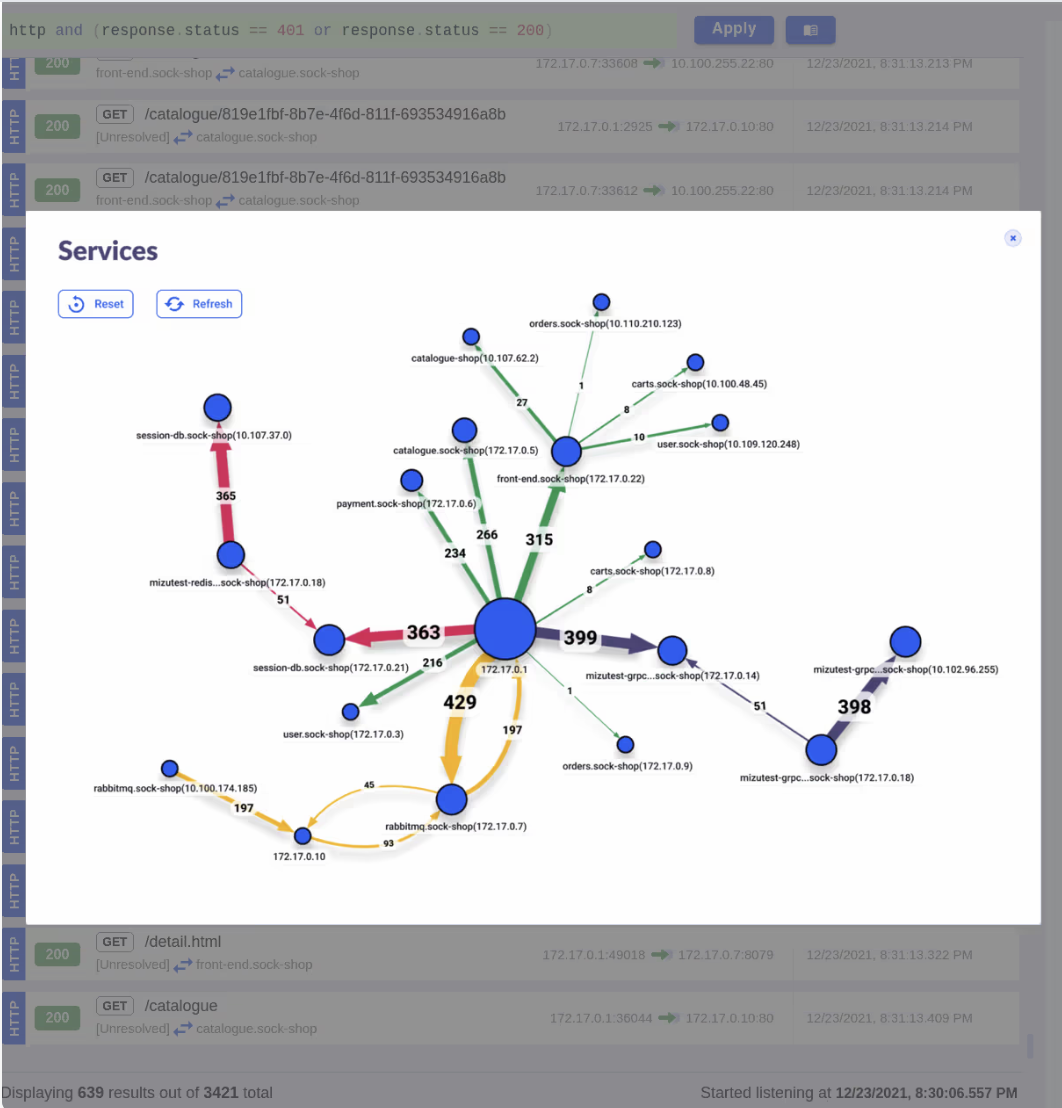
Kubernetes is a popular container orchestration platform that enables developers to manage their containerized applications. However, with its distributed nature and complexity, debugging and troubleshooting issues can be a challenge. To overcome this challenge, Kubeshark provides real-time protocol-level visibility to Kubernetes traffic, coupled with a rich query language, a service map, and a dashboard. In this blog, we will explore Kubeshark’s features, installation, network analysis, automation, and integrations with InfluxDB, Grafana, and Slack. Additionally, we will provide code snippets to help you get started.
Why to use Kubeshark?
Kubeshark is a portmanteau of “Kubernetes” and “shark,” which is a metaphorical representation of the powerful and efficient nature of Kubernetes as a container orchestration platform. Here are some reasons why “Kubeshark” might be a fitting name:
- Agility: Just like a shark is known for its agility and speed in the water, Kubernetes provides agility and flexibility in managing containerized applications. It allows for quick deployment, scaling, and management of containerized applications, making it a swift and efficient platform for modern application development.
- Scalability: Sharks are known for their ability to scale and adapt to different environments. Similarly, Kubernetes provides built-in scalability features that enable applications to grow or shrink based on demand. It can automatically handle load balancing, resiliency, and scaling of containers, making it ideal for managing applications of varying sizes and complexities.
- Efficiency: Sharks are known for their efficiency in hunting and consuming prey. Similarly, Kubernetes optimizes resource utilization and manages containerized applications efficiently, ensuring that computing resources are utilized effectively, resulting in cost savings and improved performance.
- Robustness: Sharks are known for their resilience and toughness in the face of challenges. Similarly, Kubernetes provides robustness and fault tolerance through features such as self-healing, automated rollouts, and rollbacks. It can recover from failures and maintain application availability, making it a reliable platform for running production-grade applications.
- Adaptability: Sharks have evolved over millions of years to adapt to different environments and thrive in diverse conditions. Similarly, Kubernetes is a highly extensible and adaptable platform that can work with different container runtimes, networking plugins, and storage options. It also supports custom configurations, allowing it to be tailored to specific application requirements.
Installation
To install Kubeshark, follow the steps below:
Download Kubeshark’s binary distribution latest release and run following one of these examples:
sh <(curl -Ls https://kubeshark.co/install)
kubeshark tap -A
kubeshark tap -n sock-shop "(catalo*|front-end*)"
Running any of the ☝️ above commands will open the Web UI in your browser which streams the traffic in your Kubernetes cluster in real-time.
Homebrew
Homebrew 🍺 users can add Kubeshark with:
brew tap kubeshark/kubeshark
and install Kubeshark CLI with:
brew install kubeshark
Checking Kubeshark Version
kubeshark version
39.6
1. Network Analysis
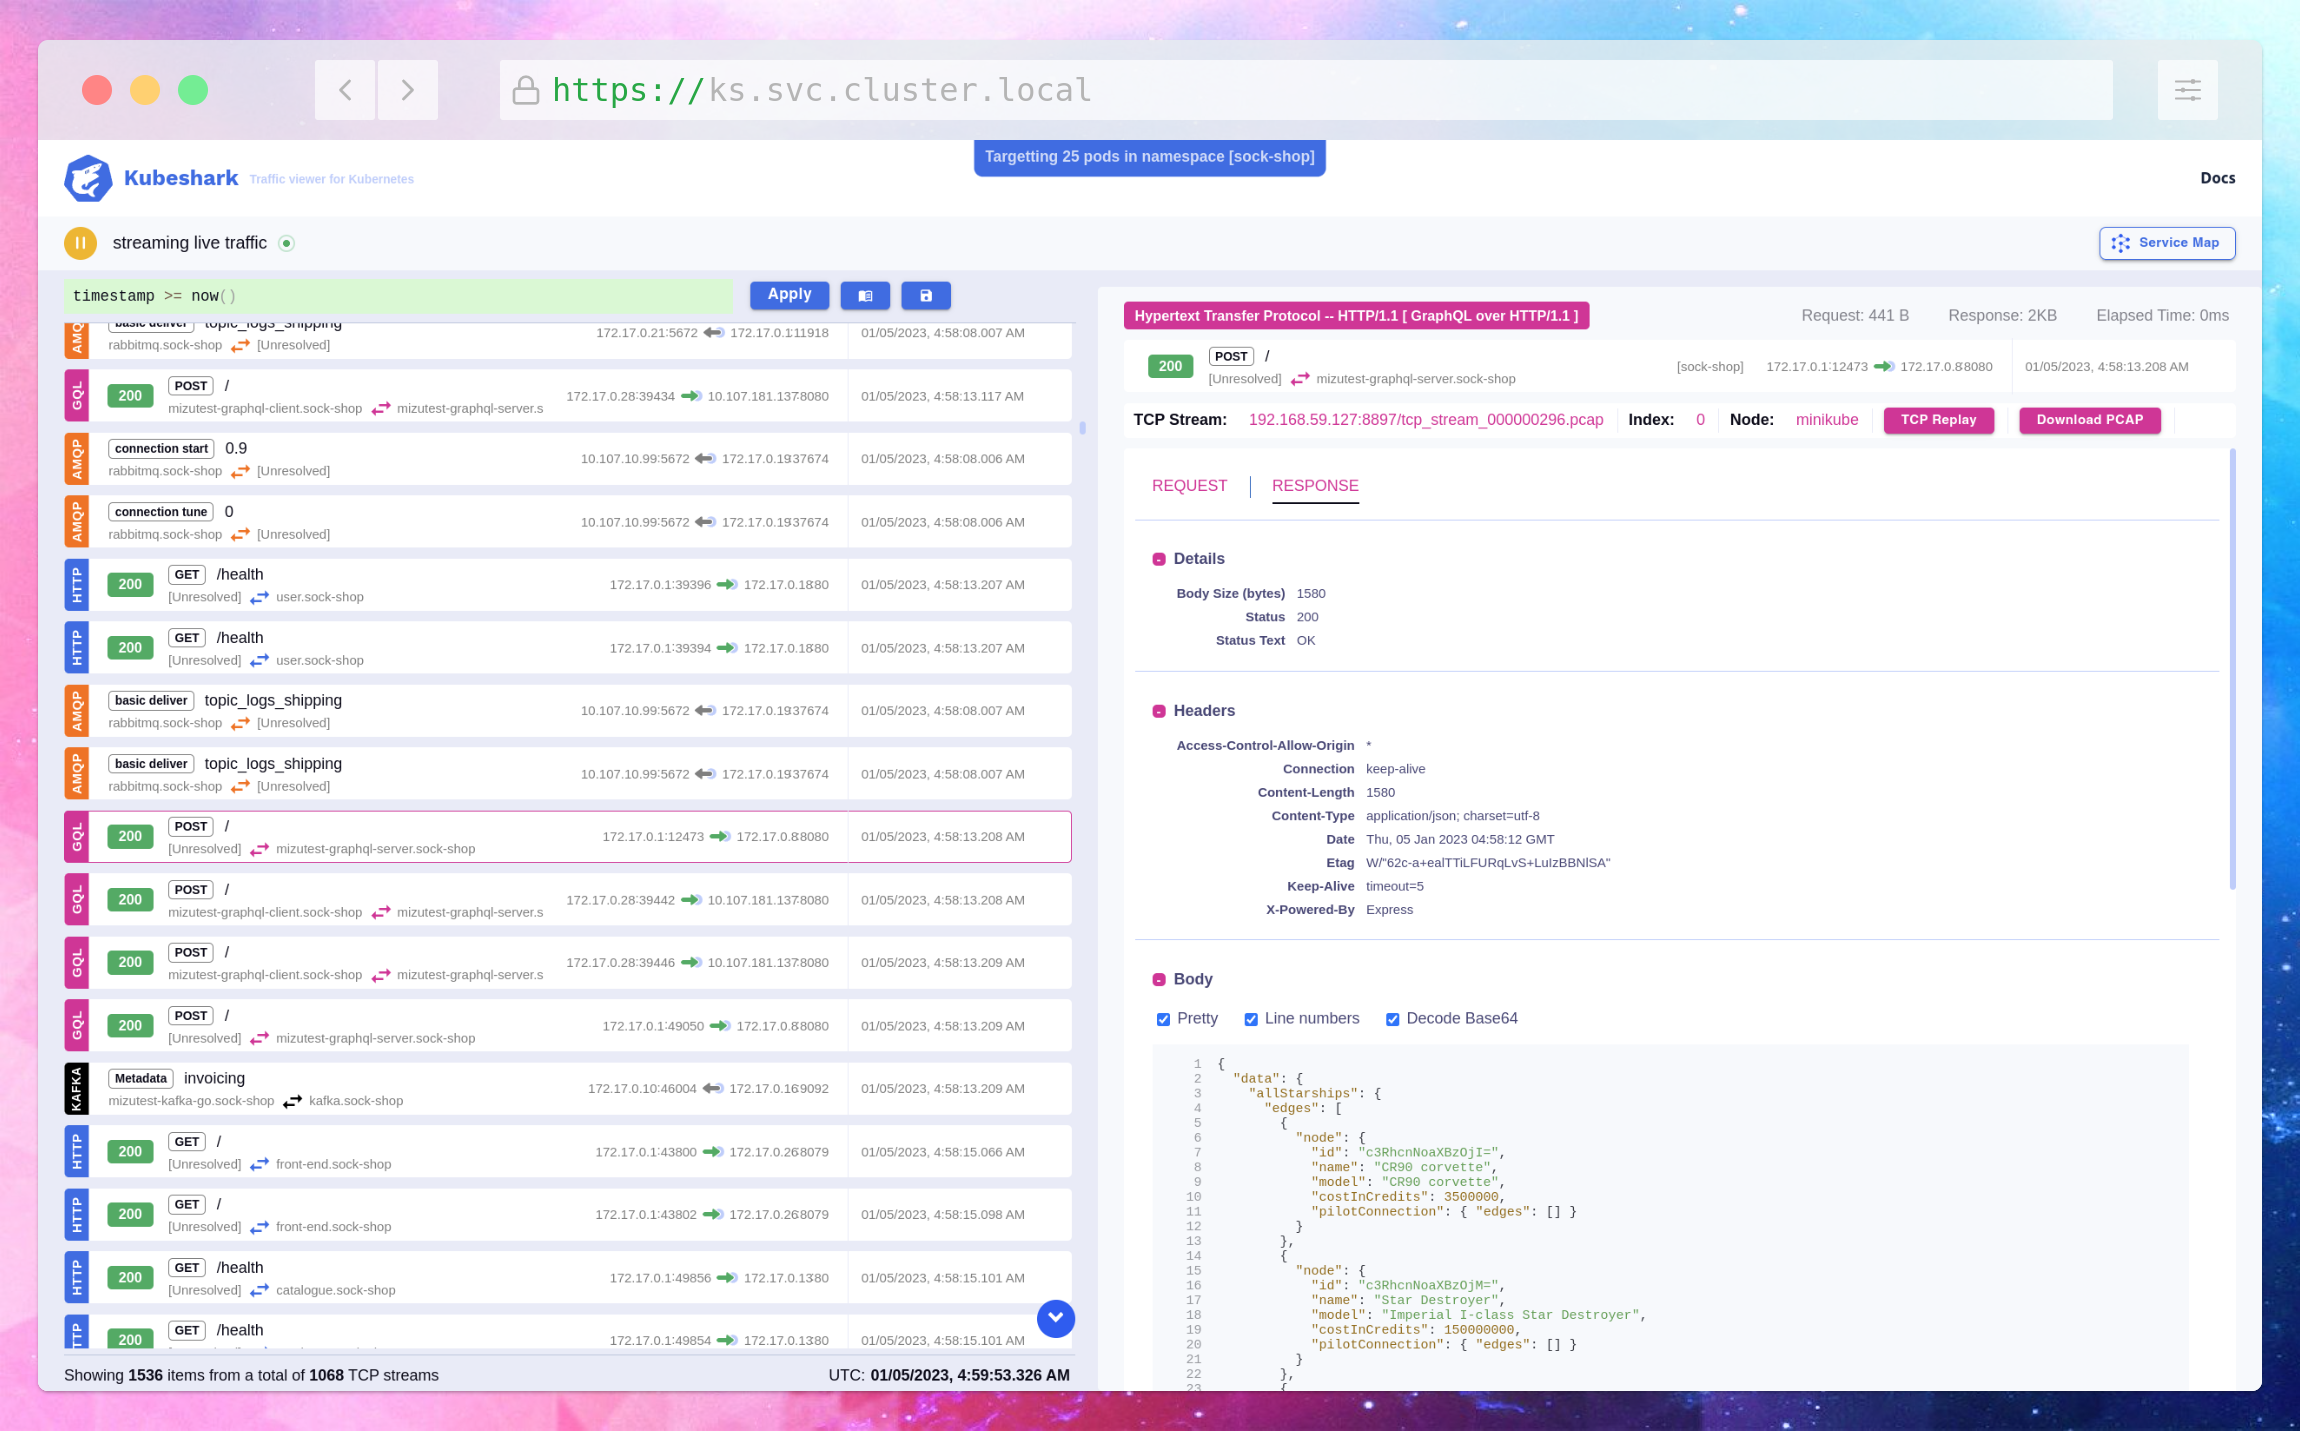
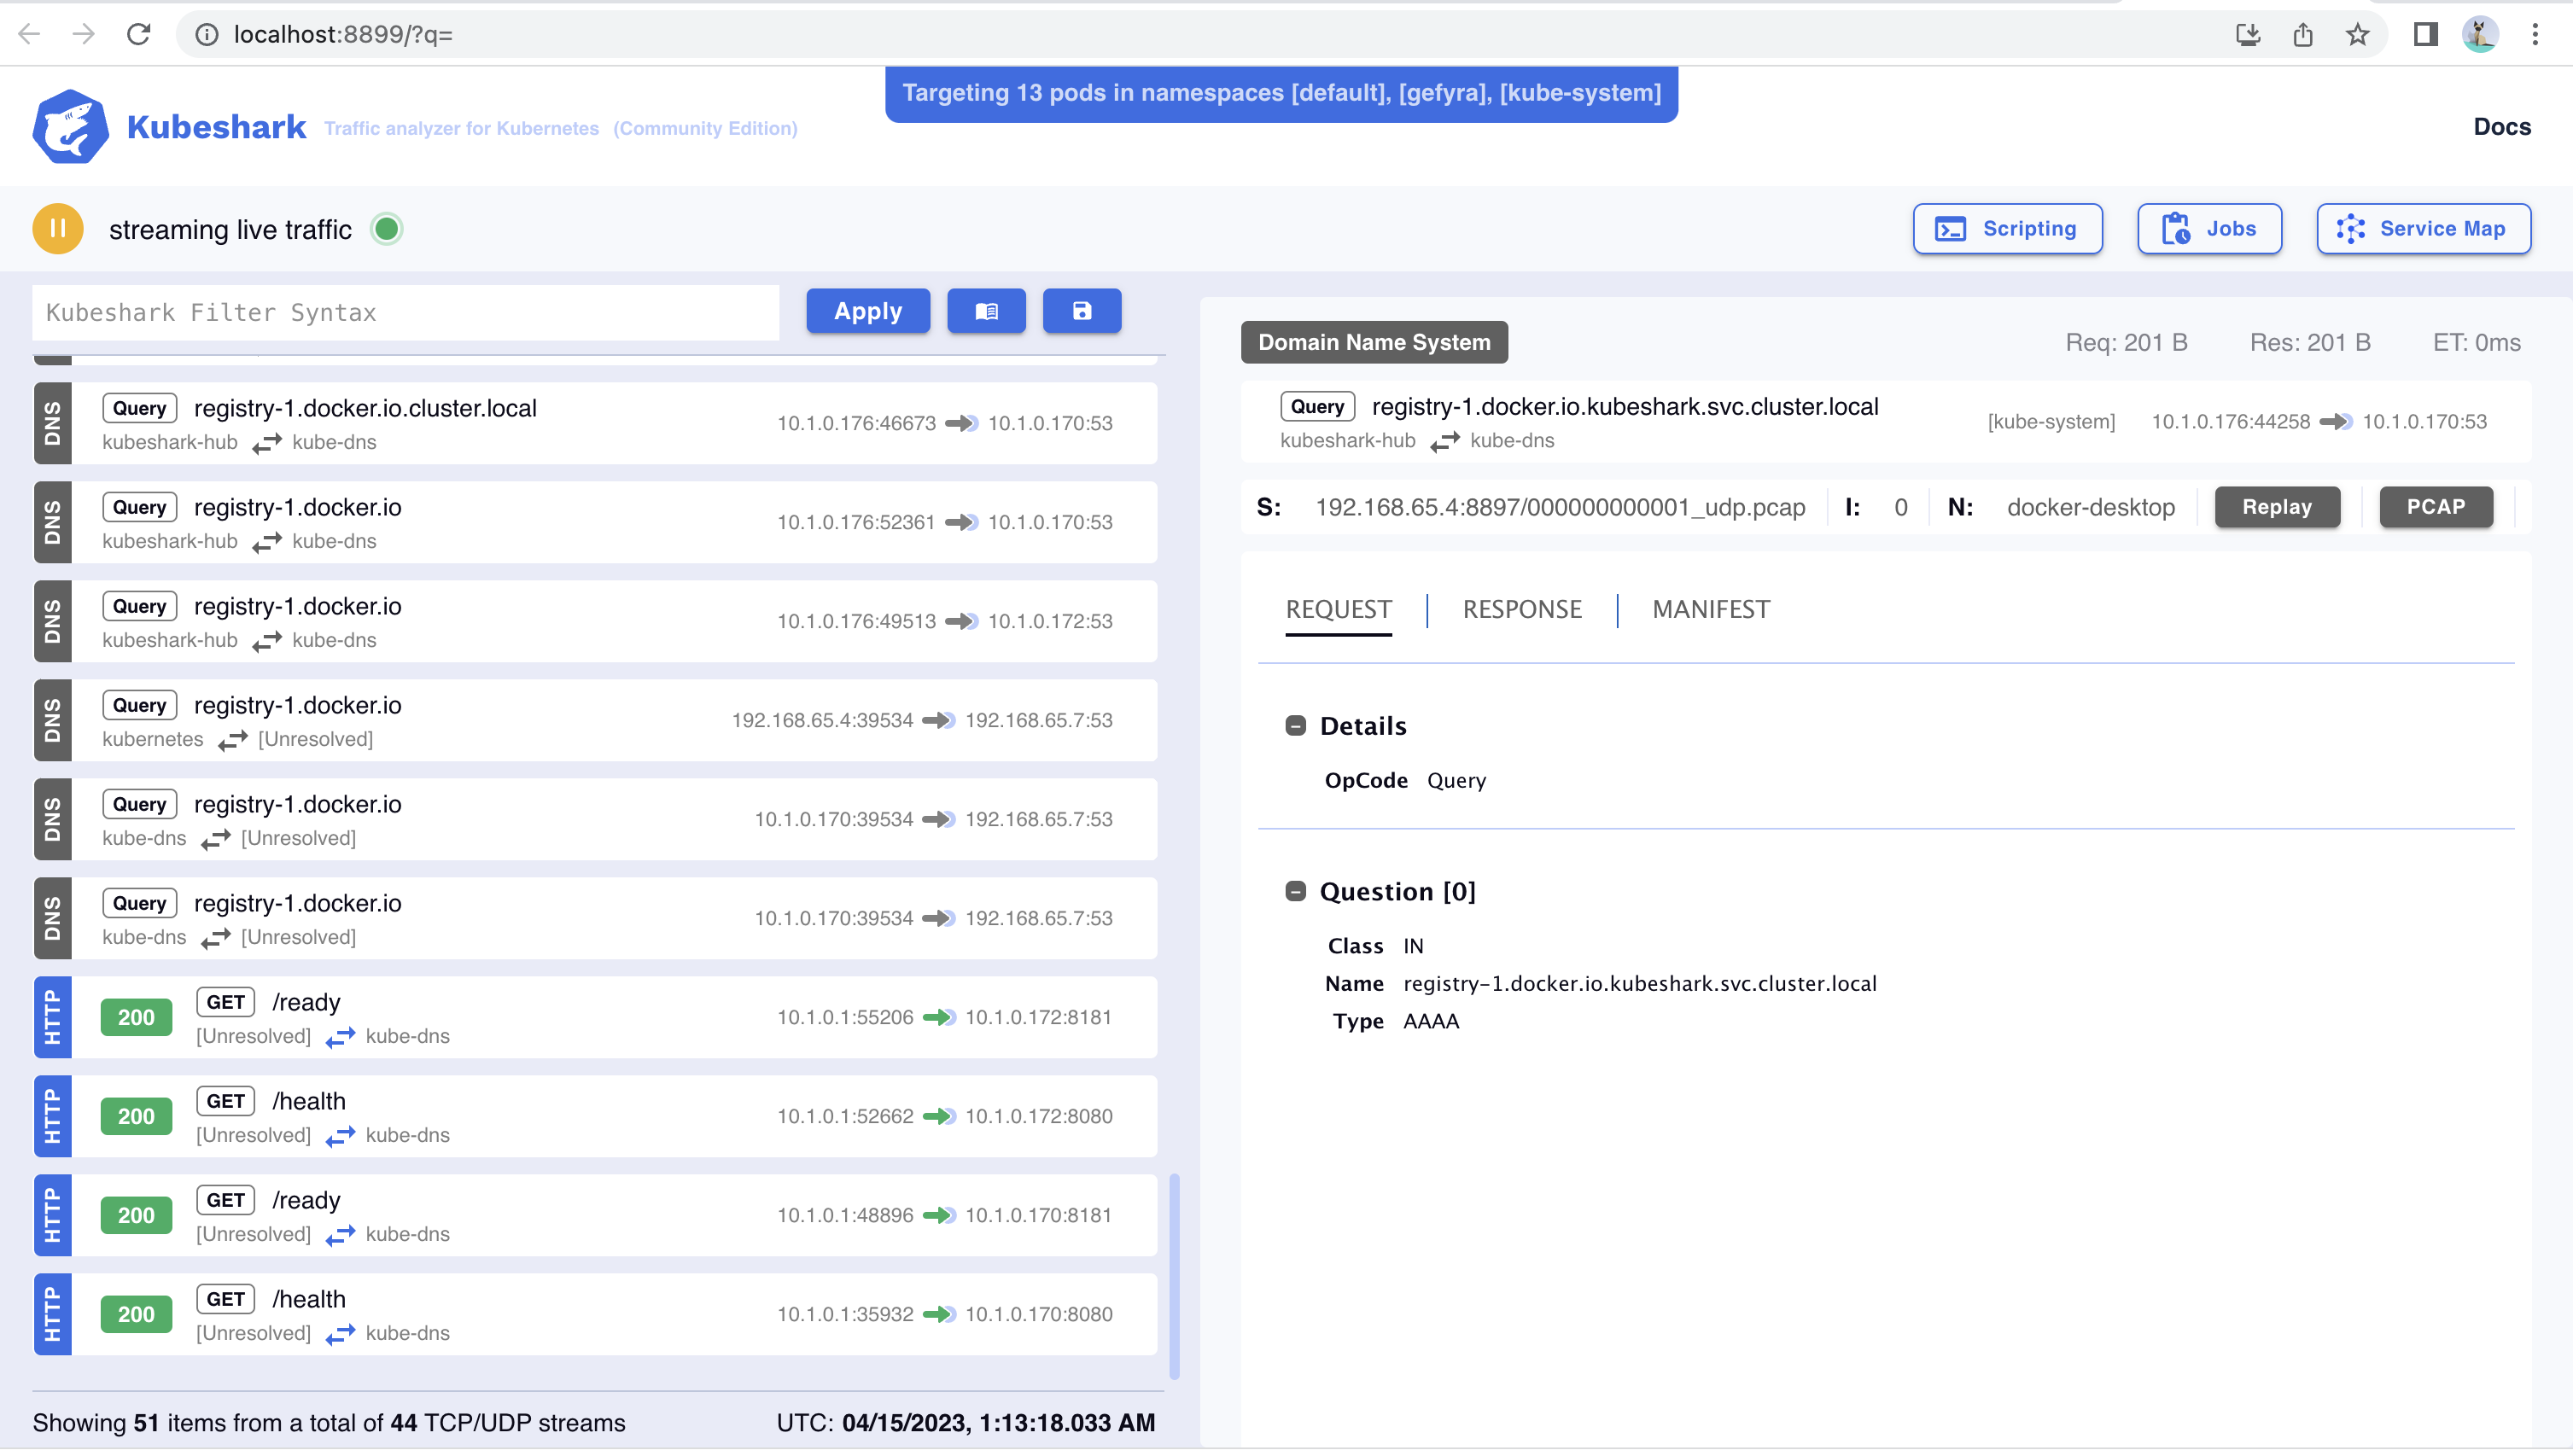
Kubeshark provides real-time protocol-level visibility to Kubernetes traffic and is designed to help users in troubleshooting an infrastructure problem, modeling new threats, and investigating a security incident. In this section, we will explore different use-cases of network analysis with Kubeshark, along with code snippets.
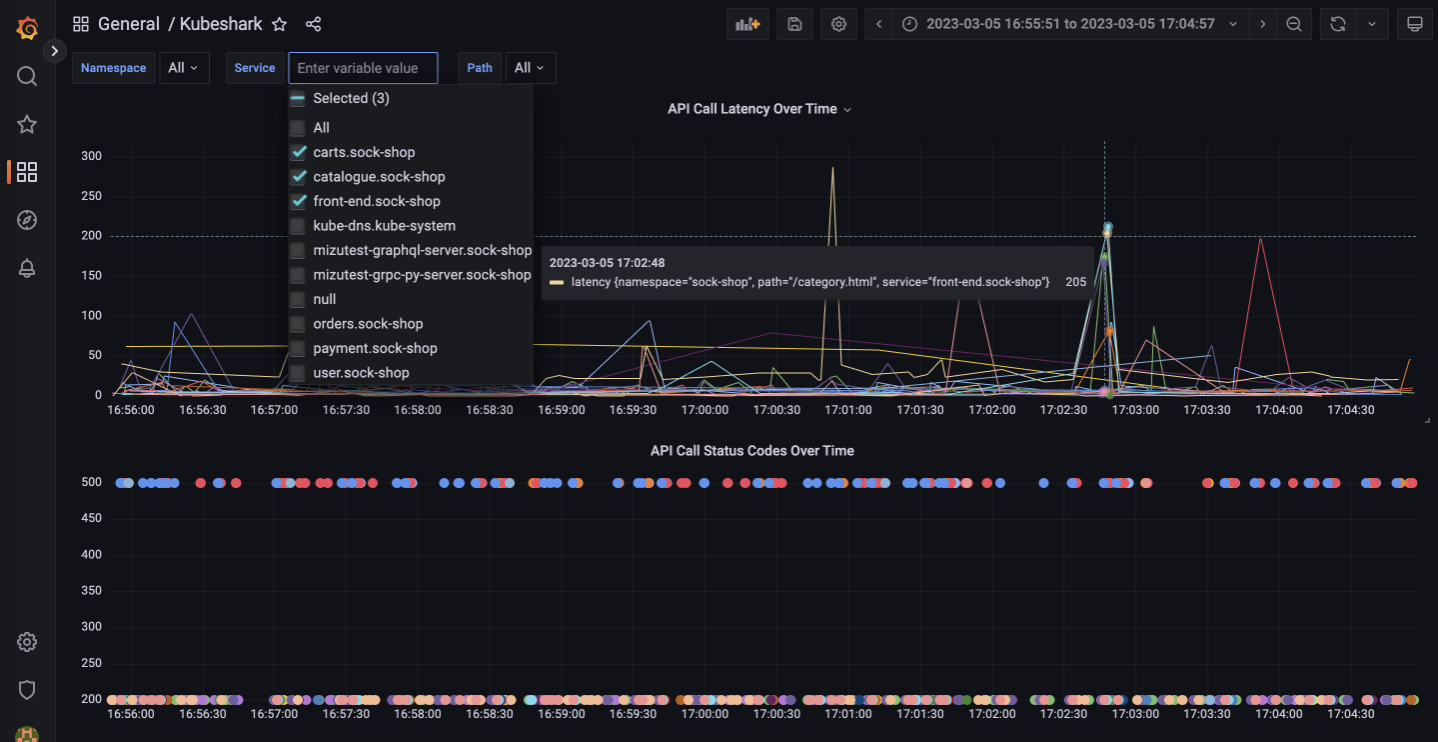
Monitoring Network Traffic: Kubeshark provides a live dashboard that displays all network traffic within the Kubernetes cluster. Users can use this dashboard to monitor network traffic in real-time, filter out irrelevant traffic, and quickly identify potential issues. The following code snippet shows how to monitor network traffic in Kubeshark:
## Open Kubeshark dashboard
kubectl kubeshark dashboard
## View all captured traffic in the dashboard
2. Investigating Traffic between Pods
Kubeshark can be used to investigate network traffic between different pods within a Kubernetes cluster. Users can use Kubeshark’s filtering language (KFL) to filter out traffic that is not relevant to their investigation. The following code snippet shows how to investigate traffic between two specific pods:
## Filter traffic between two specific pods
selector=pod1,pod2
kubectl kubeshark capture add --selector $selector
3. Identifying Security Issues
Kubeshark can be used to identify security issues within a Kubernetes cluster. Users can monitor network traffic in real-time, identify suspicious traffic patterns, and quickly respond to potential threats. The following code snippet shows how to identify traffic patterns that may indicate a security issue:
# Filter traffic that uses a specific token (or tokens in general)
request.headers["Authorization"] == r"Token.*"
4. Analyzing Historic Traffic
Kubeshark can be used to analyze historic network traffic within a Kubernetes cluster. Users can view traffic snapshots from different time periods, filter out irrelevant traffic, and identify patterns that may indicate potential issues. The following code snippet shows how to analyze historic traffic using Kubeshark:
## View traffic captured between two timestamps
start_time=2022-01-01T00:00:00Z
end_time=2022-01-02T00:00:00Z
kubectl kubeshark capture get --start-time $start_time --end-time $end_time
5. Troubleshooting Connectivity Issues
Kubeshark can be used to troubleshoot connectivity issues within a Kubernetes cluster. Users can use Kubeshark to identify network errors, packet loss, and latency issues that may be affecting network connectivity. The following code snippet shows how to troubleshoot connectivity issues using Kubeshark:
# Monitor network traffic and identify connectivity issues
kubectl kubeshark capture add --selector $selector
kubectl kubeshark capture view --selector $selector
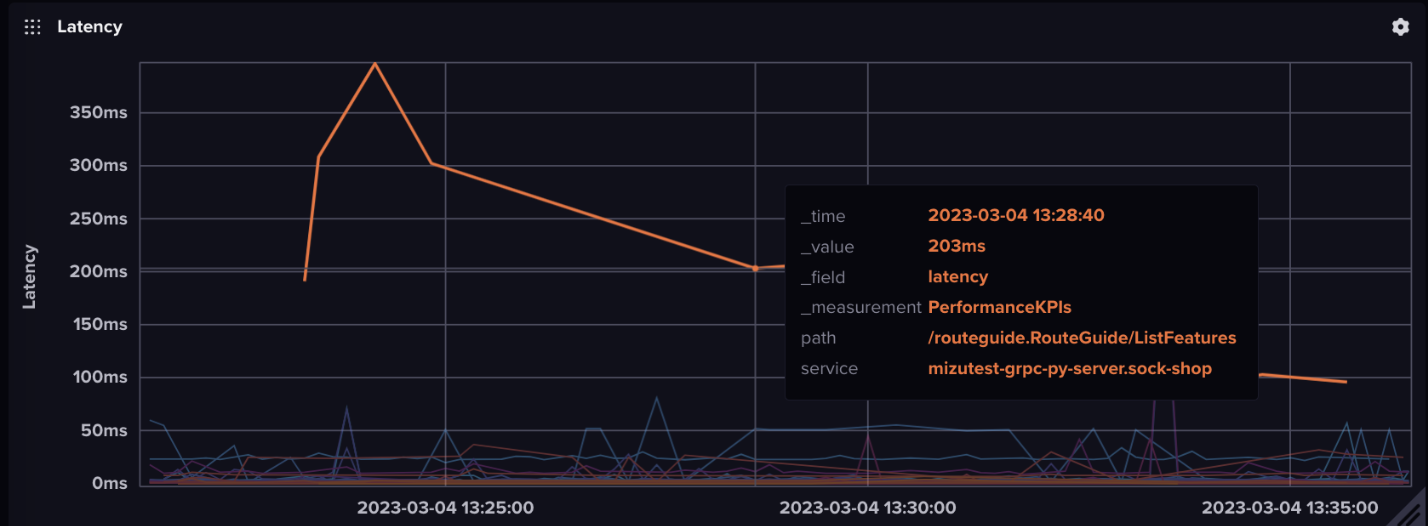
Integrations with InfluxDB and Grafana
Kubeshark provides integrations with InfluxDB and Grafana to allow users to visualize and analyze network traffic data captured by Kubeshark in real-time.
InfluxDB is a time-series database that can store and query large amounts of time-stamped data, while Grafana is a popular tool for visualizing data from various data sources.
Integrating Kubeshark with InfluxDB
Kubeshark can be configured to send network traffic data to InfluxDB using the InfluxDB Line Protocol.
To set up the integration, first install InfluxDB and create a new database to store the Kubeshark data. Then, configure Kubeshark to send data to InfluxDB by adding the following section to the Kubeshark YAML configuration file:
influxdb:
  url: http://influxdb:8086
  database: kubeshark
  user: admin
  password: password
This configuration sets up Kubeshark to send data to InfluxDB running on the http://influxdb:8086 URL, using the kubeshark database and the admin user with the password password.
Once Kubeshark is configured to send data to InfluxDB, the data can be queried and visualized using InfluxDB’s query language and Grafana.
Here is an example of querying the number of packets sent by a specific pod over a specific time range:
SELECT count(packet) FROM packets WHERE pod_name = 'my-pod' AND time > now() - 1h GROUP BY time(1m)
This query selects the number of packets captured by Kubeshark for the my-pod pod over the last hour, grouped by minute intervals. This data can then be visualized in Grafana to create a real-time dashboard of network traffic data.
Integrating Kubeshark with Grafana
- To integrate Kubeshark with Grafana, first install Grafana and set up a new dashboard. Then, add a new data source for InfluxDB by navigating to Configuration -> Data Sources -> Add data source -> InfluxDB.
- Enter the same URL, database, user, and password that were used to configure Kubeshark to send data to InfluxDB.
- Next, create a new panel in the Grafana dashboard and select the InfluxDB data source that was just added.
- Then, enter a query using InfluxDB’s query language to visualize the network traffic data captured by Kubeshark.
Here is an example of a Grafana query to visualize the number of packets sent by a specific pod over a specific time range:
SELECT count(packet) FROM packets WHERE pod_name = 'my-pod' AND time > now() - 1h GROUP BY time(1m)
This query is the same as the previous example, but it is entered in the Grafana query editor instead of the InfluxDB query editor.
Grafana provides a variety of visualization options, including line charts, bar charts, and gauges, to help users create real-time dashboards of network traffic data captured by Kubeshark.
Kubeshark Helpers with Slack
Python
In Kubeshark, helpers are predefined functions that can be used to perform common tasks in the analysis and visualization of Kubernetes resources. Some examples of helpers in Kubeshark include functions for filtering data, calculating metrics, and formatting output.
To send alerts to Slack using Kubeshark helpers, you can use the send_slack_notification helper function.
Here’s an example script that demonstrates how to use this function:
from kubeshark_helpers import send_slack_notification
import datetime

# Define the Slack webhook URL
SLACK_WEBHOOK_URL = "https://hooks.slack.com/services/XXXXXXXXX/YYYYYYYYY/ZZZZZZZZZZZZZZZZZZZZZZZZ"

# Define the message to send
message = {
    "text": f"Alert triggered at {datetime.datetime.now()}",
    "attachments": [
        {
            "title": "Details",
            "text": "Something went wrong with your Kubernetes cluster.",
            "color": "#ff0000"
        }
    ]
}

# Send the message to Slack
send_slack_notification(SLACK_WEBHOOK_URL, message)
In this script, we first import the send_slack_notification function from the kubeshark_helpers module. We then define the Slack webhook URL and the message to send. The message includes a timestamp, a title, some text, and a color (in this case, red). Finally, we call the send_slack_notification function and pass in the webhook URL and message as arguments.
Note that you will need to replace the placeholder Slack webhook URL (https://hooks.slack.com/services/XXXXXXXXX/YYYYYYYYY/ZZZZZZZZZZZZZZZZZZZZZZZZ) with your own webhook URL in order for this script to work.
BASH Script
To send alerts to Slack using Kubeshark helpers, you can use the following steps:
1. Create a new helper script to send Slack messages
Here’s an example script that uses the curl command to send a message to a Slack channel using a webhook URL:
#!/bin/bash
# Sends a message to a Slack channel using a webhook URL

# Set the webhook URL and message text
WEBHOOK_URL="https://hooks.slack.com/services/XXXXX/XXXXX/XXXXXXXXXX"
MESSAGE="$1"

# Send the message using curl
curl -X POST -H 'Content-type: application/json' --data "{\"text\":\"$MESSAGE\"}" $WEBHOOK_URL
2. Make the helper script executable using the following command:
chmod +x slack-helper.sh
3. Incorporate the helper script into a custom Kubeshark script
This allows you to monitors Kubernetes objects and sends alerts when certain conditions are met. Here’s an example script that monitors pods in a Kubernetes namespace and sends an alert to a Slack channel if any pods are in a “Pending” state:
#!/bin/bash
# Monitors pods in a Kubernetes namespace and sends an alert to Slack if any pods are in a "Pending" state

# Set the namespace and Slack channel details
NAMESPACE="default"
SLACK_CHANNEL="#alerts"

# Loop indefinitely
while true; do
  # Check for pending pods
  PENDING_PODS=$(kubectl get pods -n $NAMESPACE | grep -i 'pending' | wc -l)
  if [ $PENDING_PODS -gt 0 ]; then
    # Send alert to Slack
    MESSAGE="There are $PENDING_PODS pending pods in the $NAMESPACE namespace."
    /path/to/slack-helper.sh "$MESSAGE" $SLACK_CHANNEL
  fi

  # Wait for 10 seconds before checking again
  sleep 10
done
4. Run the custom Kubeshark script using the ks command-line tool:
ks run my-alert-script.sh
This script will run indefinitely and check for pending pods every 10 seconds. If any pending pods are found, it will send an alert to the Slack channel specified in the script.
Conclusion
Kubeshark is a powerful tool that provides real-time protocol-level visibility to Kubernetes traffic. Its rich query language, Service Map, and dashboard make it easy to investigate and debug network issues in Kubernetes. With its integration with InfluxDB and Grafana, you can also automate the analysis and monitoring of your Kubernetes network. By using Kubeshark, you can improve the reliability and performance of your Kubernetes network and ensure that your applications are always available to your users.
Leave a Reply